The Shape of Go
Contents
Every public Go module and every declared dependency in a single graph: 2,638,112 modules and 9,443,537 edges.
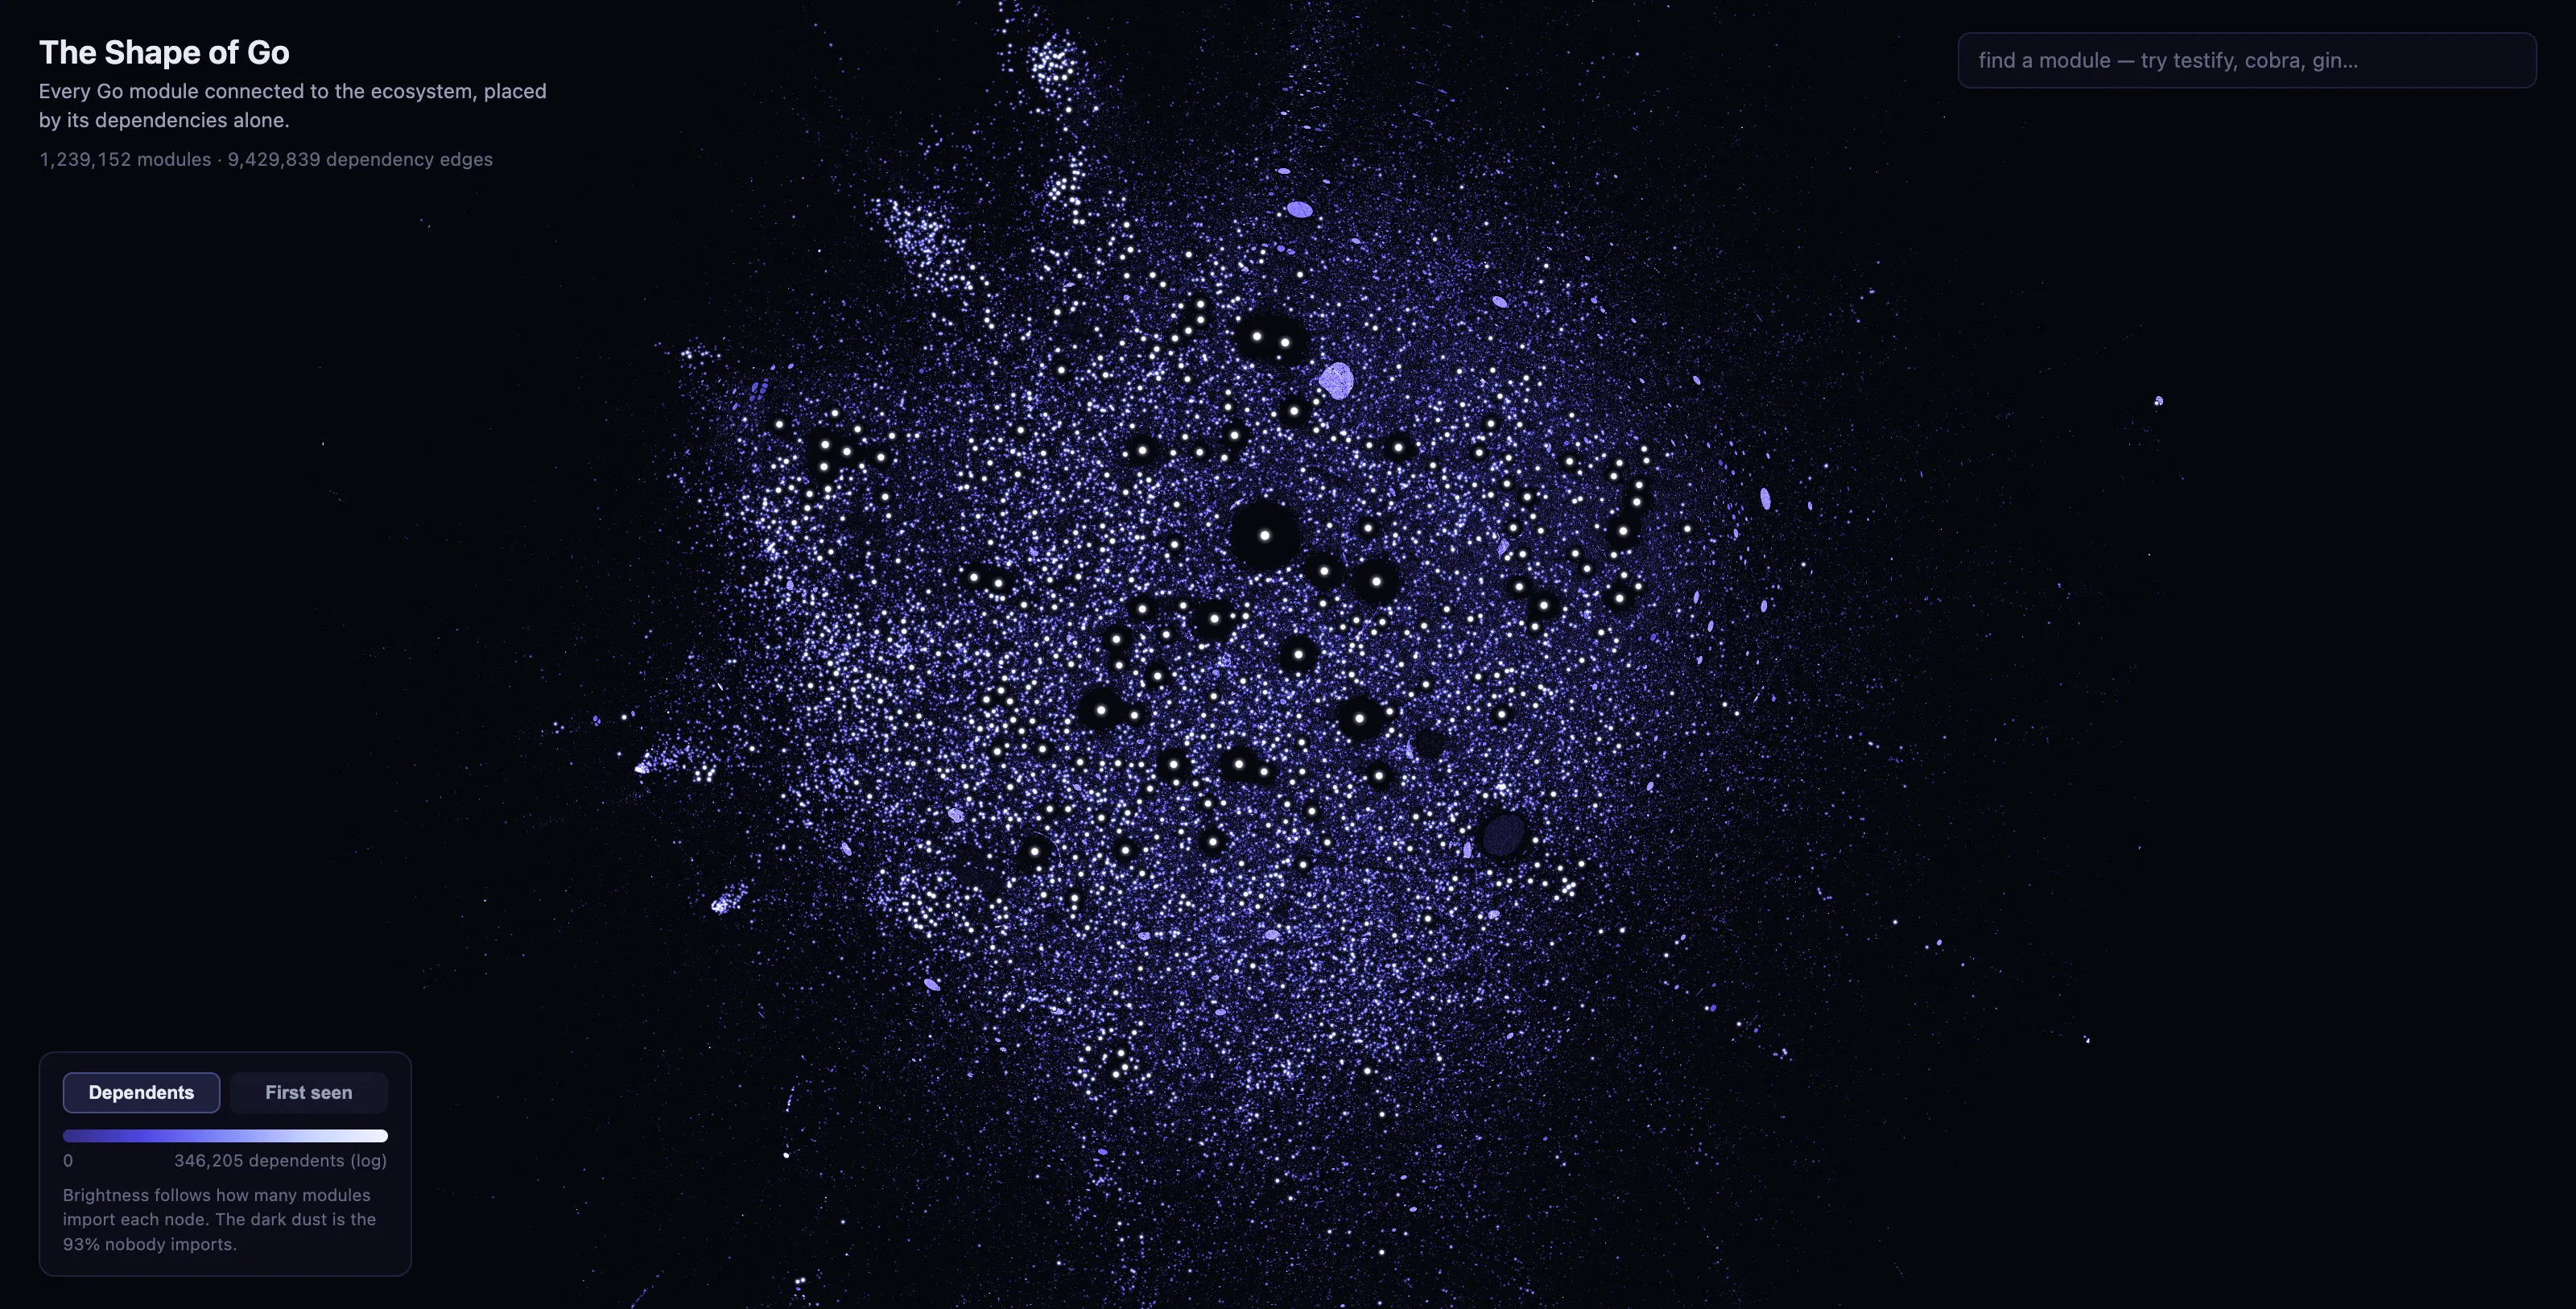
The connected half of the Go ecosystem: 1,239,152 modules, laid out by ForceAtlas2. Every point is a module; brightness follows dependent count. Explore it live.
1. One graph
The Go ecosystem has no central package registry, and yet the whole
thing is enumerable. Modules live wherever their authors put them, but
nearly every fetch flows through Google’s module proxy, and the proxy
keeps a public, append-only index of every module version it has ever
served, going back to April 2019. The proxy also serves the go.mod
file of any of those versions to anyone who asks. Both services are
official public infrastructure, the same endpoints go get uses,
which means the entire ecosystem can be reconstructed by
anyone with a laptop and some patience.
This essay is what happened when I tried. The index held 51,458,393 entries, one for every version of every module it has ever served. Dropping the golang.org/toolchain entries, which are how the Go team ships the compiler itself and not community modules, leaves 2,638,112 distinct module paths. I resolved the latest version of each path, fetched and parsed its go.mod, and joined the declared dependencies into a single graph of 9,443,537 edges: a snapshot of the public Go universe as of August 6, 2026.
The rest of the essay is a tour of that graph: which modules actually hold it up (section 4), how much of the load rests on unmaintained code (section 5), what mathematical shape the ecosystem has (section 6), how fast the part that matters is really growing (section 7), and how the map itself was built (section 10). Everything is reproducible from the accompanying repository.
2. How to read the map
The graph is built on five definitional choices, and every finding downstream depends on them.
First, nodes are module paths as published: if the index lists a path,
it is a node, including 11,000 “ghost” modules that other go.mod
files require but the proxy can no longer serve, which exist in the
graph only as targets of edges. Second, edges are direct requires only.
Each module contributes the require directives of its go.mod, with
// indirect entries filtered out, so the graph measures declared use,
not the transitive closure, and not what Go’s minimal version selection
(MVS, the algorithm that decides which versions a build actually
installs) would resolve. Third, each module appears as its latest
version at the snapshot date, so the graph is a photograph, not a
history. Fourth, major versions are separate modules: a /v2 path is a
distinct node from its /v1 ancestor, because that is how Go itself
treats them. And fifth, a require is just a require: go.mod has no way to
mark a dependency as test-only, and section 4 shows how much that
single fact shapes the top of the ecosystem.
Of the 2,638,112 module paths identified, 4,954 could not be fetched at all (section 8 explains why) and 999 go.mod files failed to parse; the remaining 2,632,159 modules, plus the 11,000 ghosts, give the graph its 2,643,159 nodes. The full pipeline, with runtimes, is in section 10.
3. Almost nobody gets imported
93.2% of Go modules, 2,463,065 of them, have never been imported by anything. More than half of all modules, 52.4%, have no dependency relationships in either direction, and 54.7% declare no dependencies of their own. The typical Go module is a repository that one person pushed once and that nothing references.
This sounds like a defect, but it is simply what an uncurated ecosystem
looks like from the inside. The index records every module path that
has ever been requested through the proxy, with no notion of relevance,
so homework assignments, weekend experiments, forks created to send a
single pull request, and internal tools that once leaked a go get
all sit on the map permanently, whether or not anyone ever depends on
them.
The part of the ecosystem that other people build on is correspondingly small: only 180,094 modules, about 7% of the total, have ever been imported by anything. Connectivity tells the same story: 1,239,152 modules, 46.9% of everything, form one large connected region, in the sense that you can walk from any of them to any other by following dependency edges in one direction or the other; the remaining 1.4 million sit in separate islands, almost all of them islands of one. The rest of this essay is about that connected half, and mostly about the 180 thousand modules that carry any weight at all.
4. The keystone
The most load-bearing module in the Go ecosystem is a test library.
github.com/stretchr/testify is imported directly by 346,205 modules.
That is 2.4 times the runner-up (google/uuid, at 146,611), and it means
that of the 1.2 million modules that declare any dependency at all, 29
percent declare testify. The Go standard library deliberately ships
without an assertion helper, and the long-standing argument for that
choice is that plain test code is enough. Judging by its go.mod files,
the ecosystem disagrees.
Testify at #1 is not a new observation: Thibaut Rousseau reached the same conclusion in January by counting dependents from the same module index. His question was which module has the most dependents. This essay is about what sits underneath that count.
Dependent count measures popularity, and popularity is not the same thing as load. To measure load I ran PageRank over the dependency graph: a module matters if modules that matter depend on it, recursively. Popularity and load mostly agree at the very top (testify is #1 on both boards), but the places where they disagree are the most revealing.
golang.org/x/sys is #2 by PageRank with a direct dependent count of
only 61,998, well behind uuid, cobra, and grpc. Hardly anyone imports
x/sys directly; it arrives in your build as a dependency of your
dependencies, and rank flows down to it from the whole ecosystem
above. google/uuid is the mirror image: #2 by dependent
count, #19 by PageRank. Nearly 150 thousand modules use it, but very
little infrastructure stands on it, which makes it popular rather than
load-bearing.
And then there is the strangest entry in the ranking. Sitting at #6 by
PageRank, above protobuf, x/crypto, cobra, grpc, and gin, is
gopkg.in/check.v1: a test framework from the pre-modules era,
unmaintained for years, with 5,020 direct dependents, and one that most
Go developers today have never used directly.
It gets there through a short chain of requires. testify declares exactly four dependencies: yaml.v3, go-spew, go-difflib, and objx. yaml.v3, with 70,816 dependents of its own, declares exactly one dependency: check.v1, its test framework. check.v1 declares exactly one: kr/pretty. And kr/pretty declares two: kr/text and rogpeppe/go-internal. Every single module in that chain lands in the PageRank top 25. kr/text is #23, with 696 direct dependents. objx, which exists mostly so testify’s mock package can work, is #14, with 1,294.
This reflects a real property of Go: a require directive does not say why a dependency is there, so a build dependency and a test-only dependency occupy the same line in the same block. When a third of the ecosystem stands on testify, and testify stands on yaml.v3, and yaml.v3 stands on its test framework, the test framework of a yaml parser becomes, structurally, one of the ten most load-bearing artifacts in the ecosystem today. The modules holding up the Go world are not the ones on anyone’s radar, and several of them are maintained by nobody.
You can see all of this in the galaxy viewer. Click testify and 346,205 points light up yellow at once, spread across a third of the visible galaxy. Click kr/text and the galaxy barely flickers: 696 points, almost all of them other load-bearing infrastructure. The two clicks show the two halves of the same finding, popularity in the first case and load in the second.
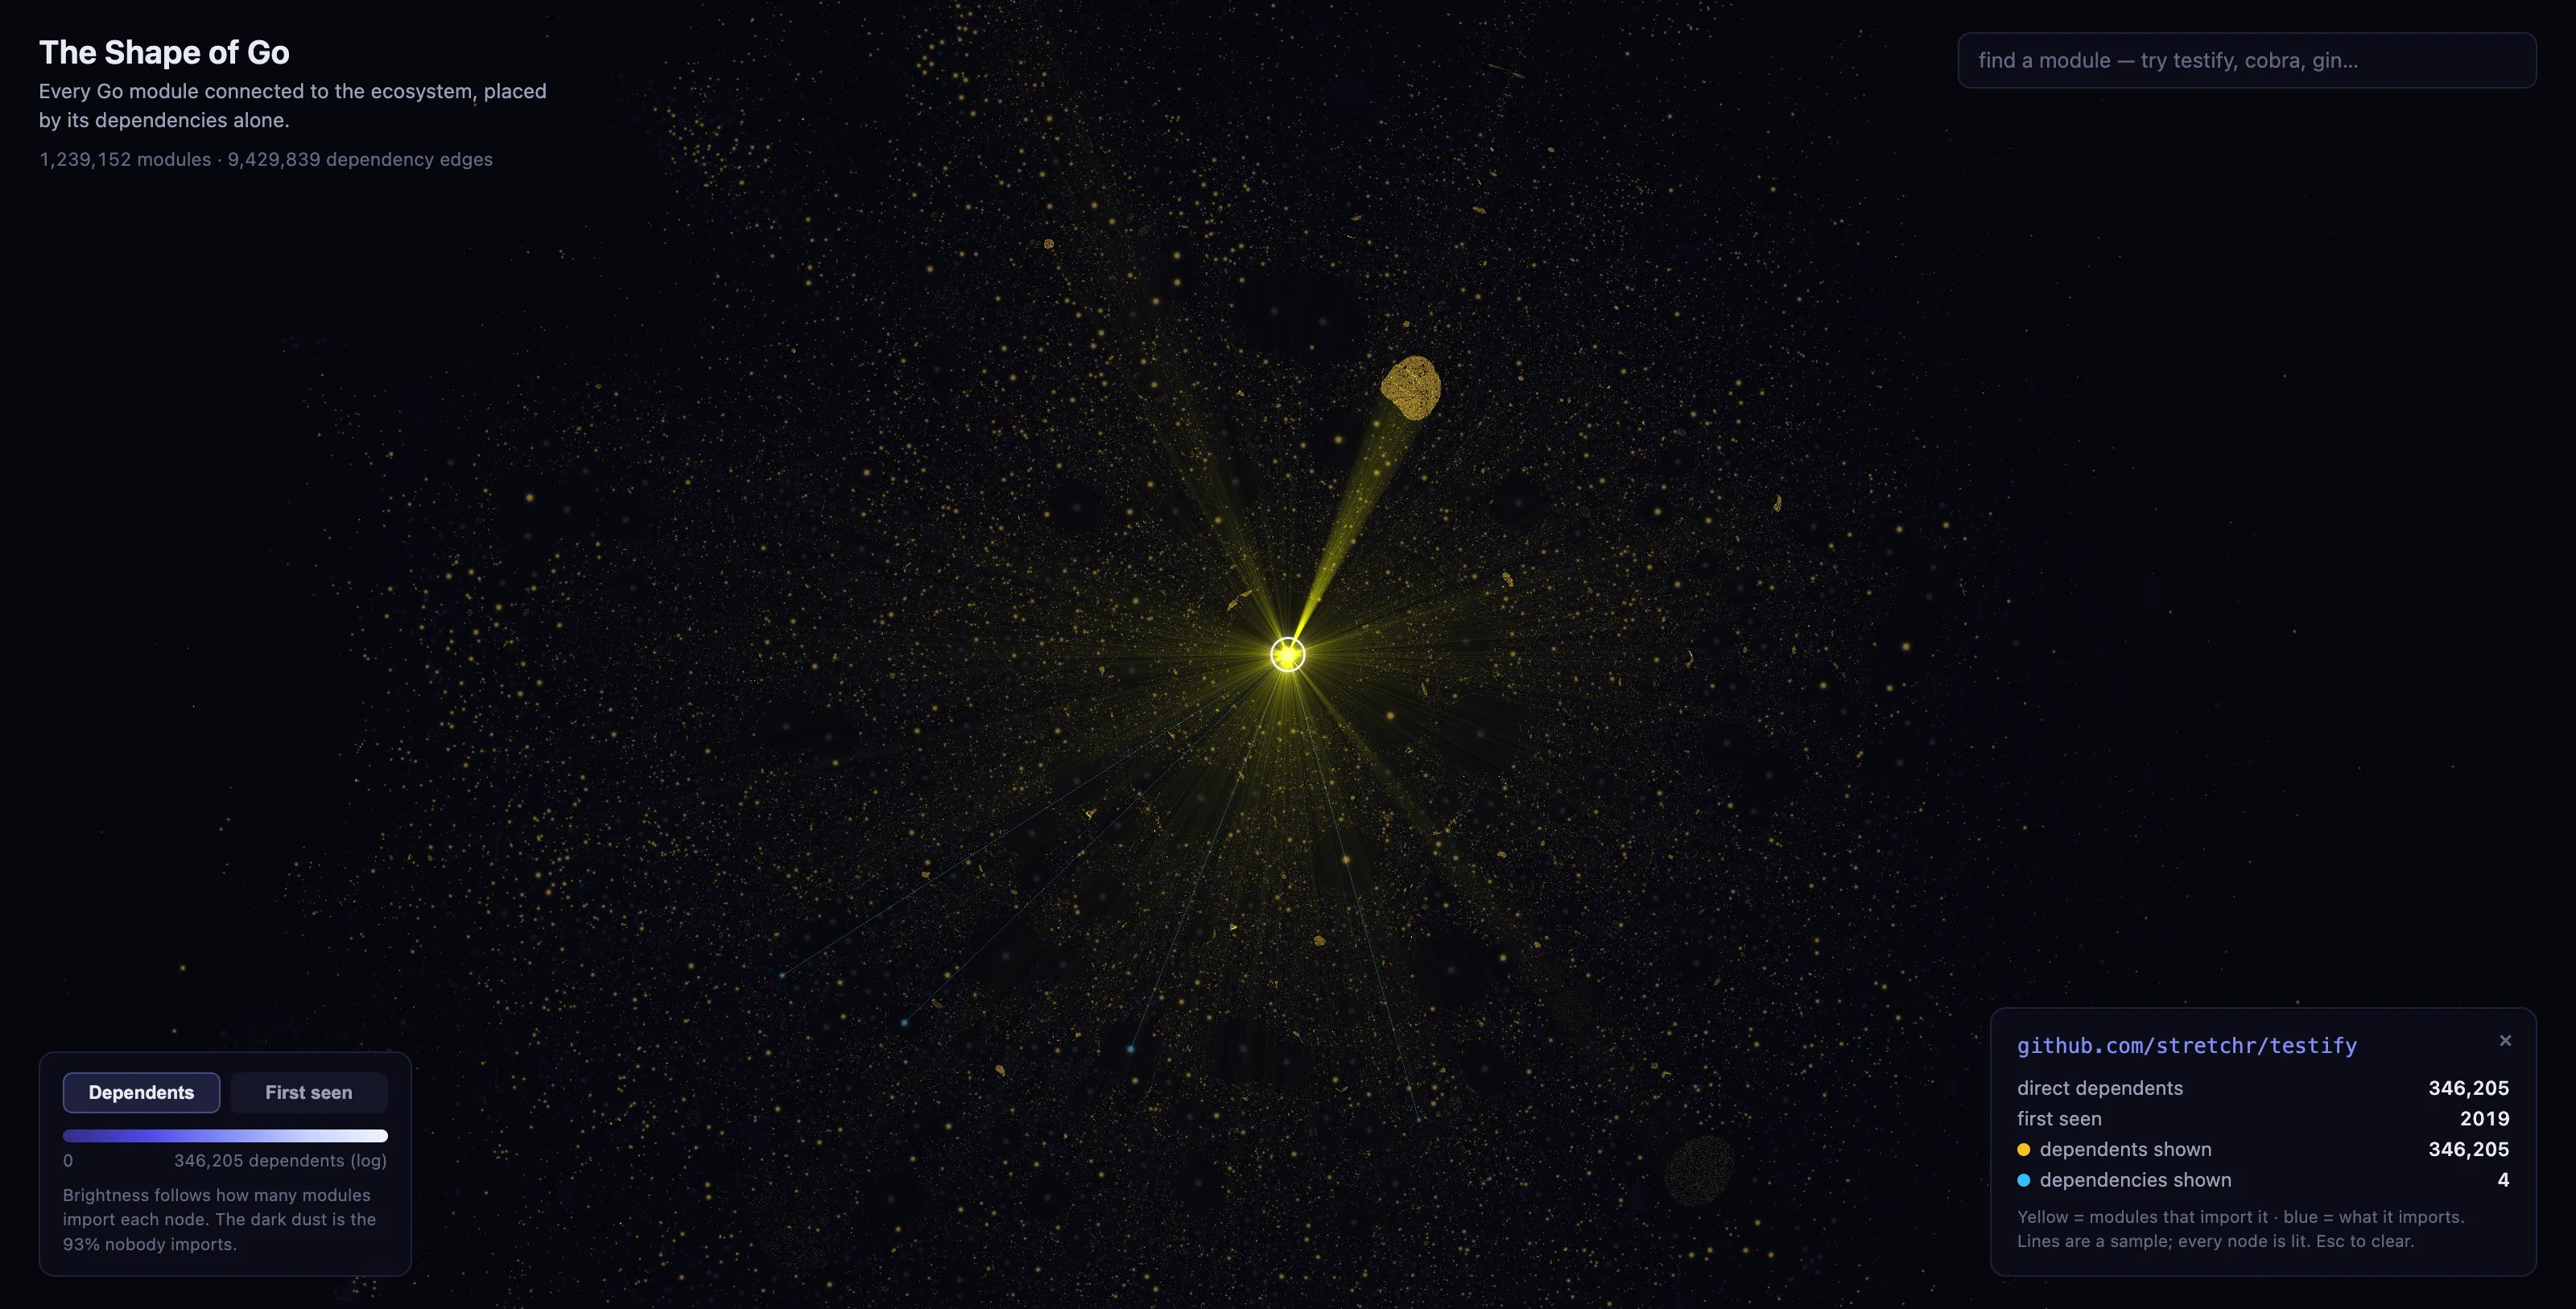
Clicking testify: all 346,205 direct dependents light up at once. First by dependent count, first by PageRank.
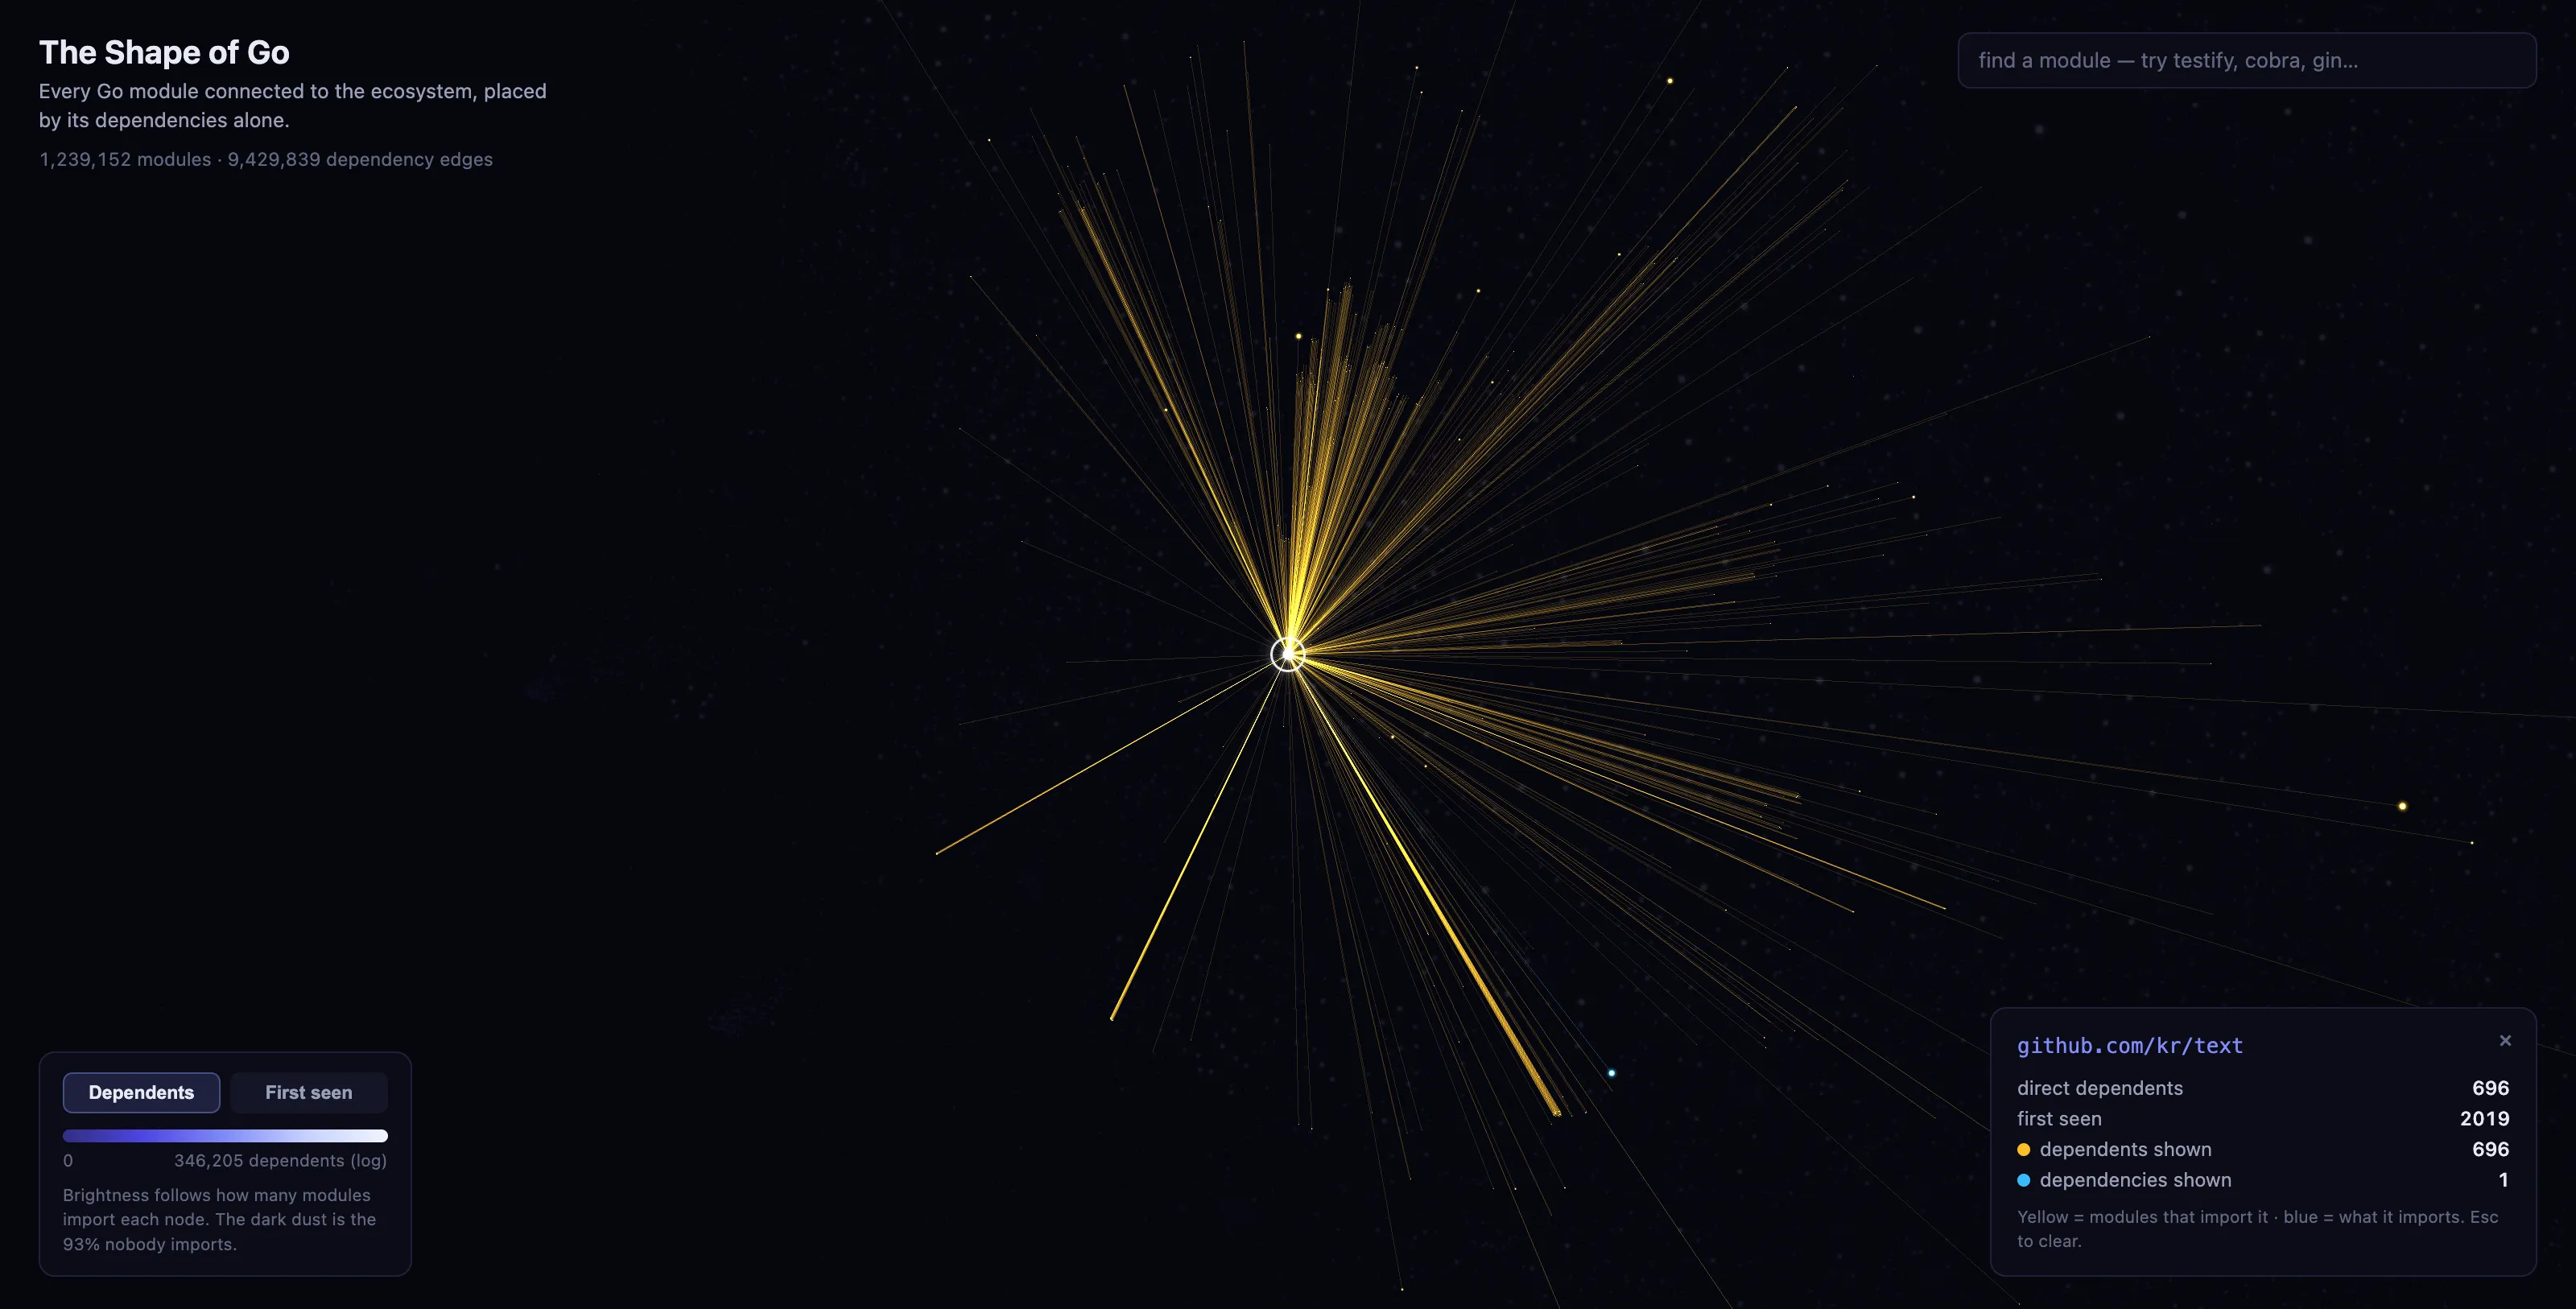
Clicking kr/text: 696 direct dependents, nearly all of them other load-bearing infrastructure. Rank 23 by PageRank on 696 dependents.
5. Finished projects
Section 4 established who carries the load. The natural next question is how well maintained the load-bearing modules are, and for much of the top of the ranking the answer is that the projects are finished.
github.com/pkg/errors is #7 by dependent count, with 109,156 modules
importing it directly. Its repository has been archived and read-only
since 2021, its purpose largely absorbed by the error wrapping that
entered the standard library with Go 1.13, back in 2019. One place
below it sits sirupsen/logrus at 96,502 dependents, which has
described itself as in maintenance mode for years and accepts no new
features. github.com/golang/protobuf is officially deprecated in
favor of google.golang.org/protobuf, and the two share the top 25:
the successor at #6 with 114,088 dependents, the deprecated original at #18
with 63,567, still more than half its replacement’s count. And both
yaml.v2 and yaml.v3 sit in the top 25 (60,421 and 70,816 dependents
respectively) even though their shared upstream repository was declared
unmaintained and archived in 2025.
PageRank tells the same story with different names: pkg/errors holds #25, golang/protobuf #15, and check.v1 and kr/pretty from section 4, quiet for years, hold #6 and #9.
The pattern is about to get a live test. Go 1.27, released on August
19, adds a uuid package to the standard library with the same
sixteen-byte representation as google/uuid, the #2 module on this
chart at 146,611 dependents. Migration is a one-line import change, so
this is as close as standard-library absorption gets to a controlled
experiment. pkg/errors suggests how it will go: its replacement entered
the standard library seven years ago, and it holds #7 today. Dependency
edges are written once and revisited almost never: the standard library
absorbs a module’s future, not its past. We’ll see in 2033.
6. The shape
Sections 4 and 5 were about individual modules. This section is about the distribution they sit in, because the concentration they showed is not an accident of a few famous libraries, but a structural property of the whole graph.
In plain terms: most modules have no dependents, a modest number have a few, and a tiny elite absorbs almost everything. The average module has about 3.6 dependents, but the average is close to meaningless here, because the distribution has no middle for it to describe. This is a heavy-tailed distribution, close to what network science calls a scale-free network, the same family of shapes that shows up in citation counts, city sizes, and links on the web, and it is what makes the single points of failure of sections 4 and 5 possible in the first place.
The standard explanation for how a network grows into this shape is preferential attachment: new modules mostly depend on libraries that are already widely depended on, so an early lead compounds, and the popular get more popular simply because they are popular. Nothing about that requires the winners to be the best available option. It only requires that visibility scales with adoption, which is how choosing a library actually works: people reach for what they have already seen used.
A graph with this shape makes a specific trade. It barely notices random failure, since a module picked at random is almost certainly dust that nothing depends on. In exchange, the load concentrates at the top, through so few nodes that sections 4 and 5 could name them individually. The fitted distribution, exponent and caveats included, regenerates from one command in the repository for anyone who wants the statistics.
7. Twenty thousand a year
Here is the module index’s version of recent history. New module paths by the year they first appeared:
| year | new module paths |
|---|---|
| 2019 | 90,655 |
| 2020 | 196,506 |
| 2021 | 274,242 |
| 2022 | 194,530 |
| 2023 | 213,826 |
| 2024 | 867,456 |
| 2025 | 450,788 |
| 2026 (to Aug 6) | 350,110 |
Steady growth for four years, and then 2024 quadruples the previous year. You can guess the tempting explanation, because it is the explanation for every 2024 chart: AI coding tools went mainstream, and suddenly everyone could publish a Go module.
The index cannot settle that. A module enters the index the first time anything requests it through the proxy, not when it is created. I sampled thirty modules from the 2024 cohort by hand: mostly forks nobody touched again, tutorial and homework repos, and mirror domains from security scanners sweeping GitHub. That sample is consistent with an AI publishing wave, and it is equally consistent with scanners mechanically requesting the long tail of GitHub through the proxy and dragging it into the index. The publication table cannot tell those apart. (2019 is inflated the opposite way: the index opened in April 2019, so everything older got swept into its first year.)
But there is a better question: of the modules born each year, how many were ever imported by anyone?
| cohort | new paths | ever imported | never imported |
|---|---|---|---|
| 2019 | 90,655 | 29,588 | 67.4% |
| 2020 | 196,506 | 22,639 | 88.5% |
| 2021 | 274,242 | 19,944 | 92.7% |
| 2022 | 194,530 | 19,995 | 89.7% |
| 2023 | 213,826 | 21,862 | 89.8% |
| 2024 | 867,456 | 21,965 | 97.5% |
| 2025 | 450,788 | 17,906 | 96.0% |
| 2026 (to Aug 6) | 350,110 | 15,237 | 95.6% |
Read the third column from top to bottom: leaving aside the first year, it stays near twenty thousand every single year. In 2024, the year the ecosystem published four times as much as the year before, the number of new modules that anyone actually used was 21,965, right on the baseline. Of 2024’s 867,456 newcomers, 845,491 have zero dependents.
The 2024 wave mostly added noise. The Go ecosystem that other people build on grows by about twenty thousand modules a year, every year since 2020, indifferent to publication volume.
Two caveats. First, younger cohorts have had less time to accumulate importers, so their “ever imported” counts will still drift up; but 2024 is already 1.5 to 2.5 years old and sits exactly on the baseline, and even the older cohorts settle near ninety percent never-imported. Second, “imported” here means direct requires of latest versions, per the graph definition in section 2.
The galaxy shows the same story. Colored by cohort, the 2024-2026 newcomers are gold dust wrapped around an older core, and up close that dust is leetcode solutions, course homework, and one-off forks: thousands of modules with near-identical edge profiles (“imports testify, imported by nobody”).
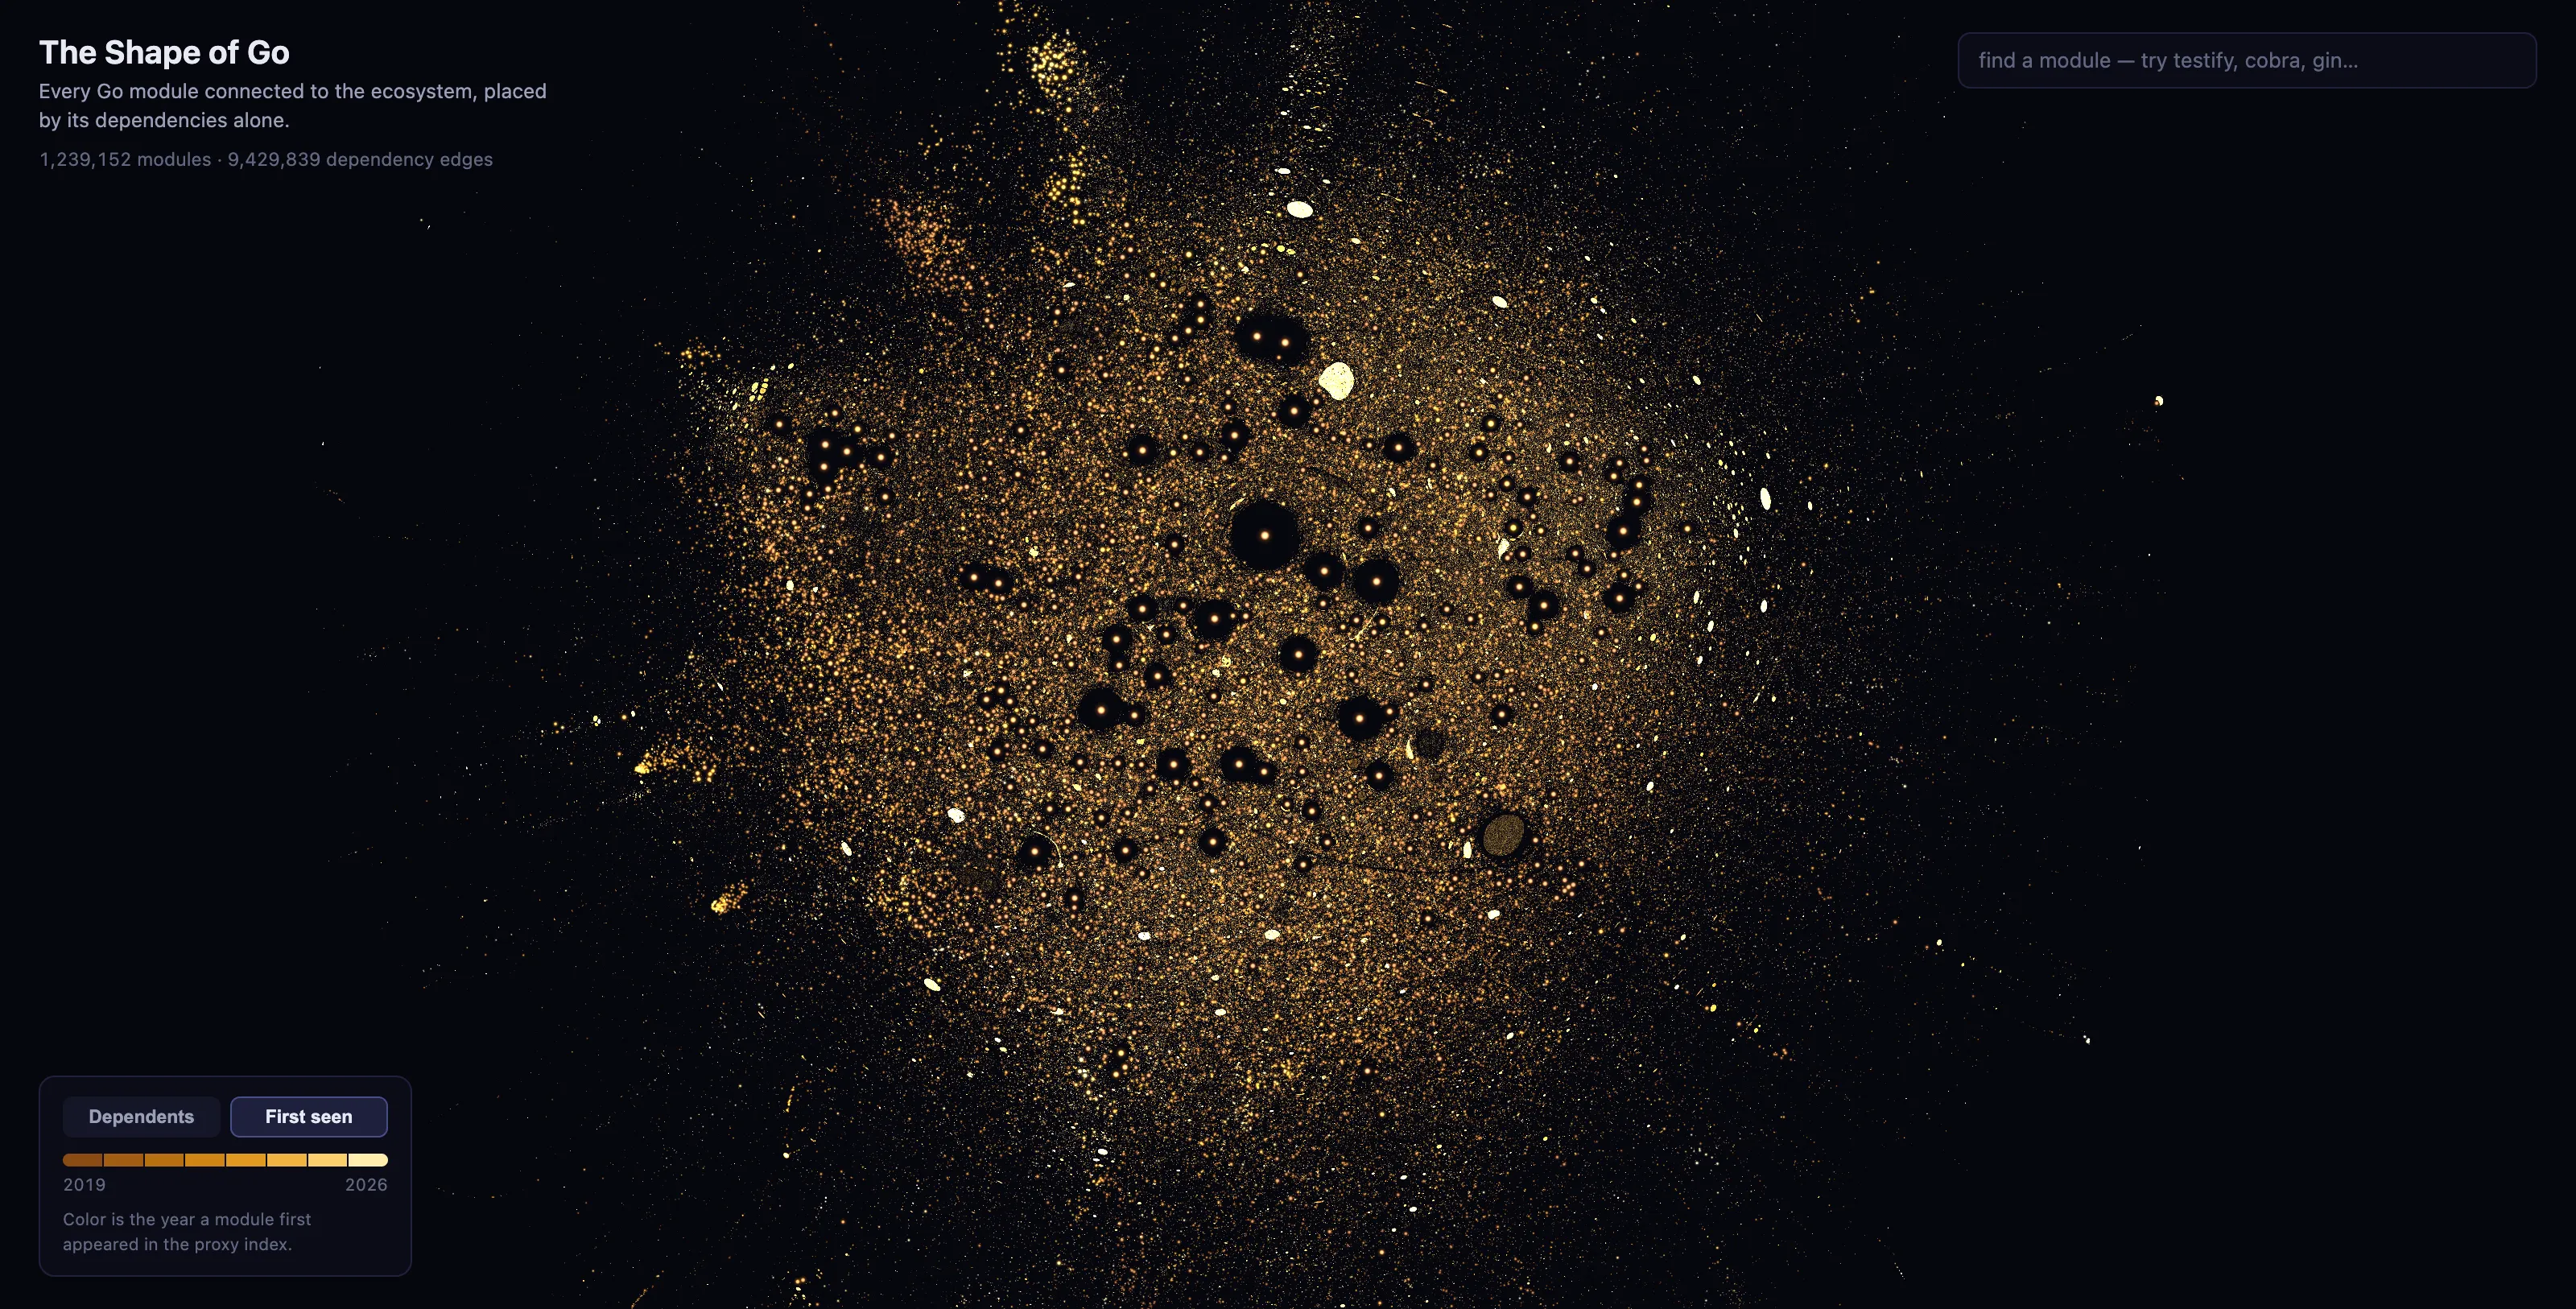
Color is the year a module first appeared in the index, dark 2019 to bright 2026. The bright dust is the recent publishing wave; the dark hubs at the center are the old core everything stands on.
8. Field notes
Some findings do not change the shape of the graph but are worth reporting anyway.
A quarter of the universe has the wrong nameplate. 630,550 modules,
24% of every go.mod parsed, declare a module path inside the file that
differs from the path they are published under. The overwhelming
majority are forks: someone forked a repository, published it at a new
path, and never edited the module line. The mismatch only turns into
an error when someone actually tries to require the fork at its new
path, which, judging by how long these go.mod files have sat unfixed,
almost nobody does.
Google runs what looks like a quiet malware blocklist. 4,917 modules cannot be fetched from the proxy at all: it refuses them with the message “may be dangerous to execute”. I have not found this behavior documented anywhere, and I discovered it only because these modules return 403 at any request rate, which for a while looked like rate limiting and turned out to be policy. Another 37 modules are plain 404s. Everything else, 2,633,158 module paths, fetched cleanly.
999 go.mod files do not parse. A suspiciously round number of modules publish a go.mod so broken that the official parser rejects it. They are in the index, and some may even be importable at older versions, but as latest versions they contribute nothing but their node.
The out-degree champions. The most dependency-hungry module in Go is yandex/perforator, which declares 1,029 direct dependencies. The tree-sitter grammar bundles declare 513 each, and datadog-agent 479.
Three of the top 25 belong to Kubernetes. The three are k8s.io/apimachinery (67,827 dependents), k8s.io/client-go (60,488), and k8s.io/api (55,201), a useful reminder of how much of modern Go exists in Kubernetes’s orbit.
9. The galaxy
Every render in this essay comes from a two-dimensional embedding of the 1.24-million-node connected component, computed with ForceAtlas2, a force-directed layout algorithm in which every module repels every other and every dependency edge pulls its two ends together.
The first thing the map shows is that the big hubs sit inside voids. Everything repels everything in this layout, but only hubs get a bubble: a hub’s thousands of dependents are all pulled toward it, so they pack into a dense halo around it, and the halo’s combined repulsion pushes every unrelated module out of the neighborhood. The size of the void grows with the crowd: testify, uuid, and cobra are bright stars centered in their own dark hollows.
Clicking a module lights its direct dependents in yellow and its dependencies in blue. For the biggest hubs the viewer draws only a sample of the edge lines above 20,000 (drawing them all would white out the screen) and says so on screen; the highlighted nodes are always all there.
Some structures need a second look before they make sense. gmlewis/go-fonts sits in deep space with 1,275 dependents, which looks like a layout error until you check the edges: 1,274 of those dependents are the author’s own generated font sub-modules, and exactly one external module uses the family. Families of single-owner sub-modules like this one appear all over the rim as tight, uniform pods.
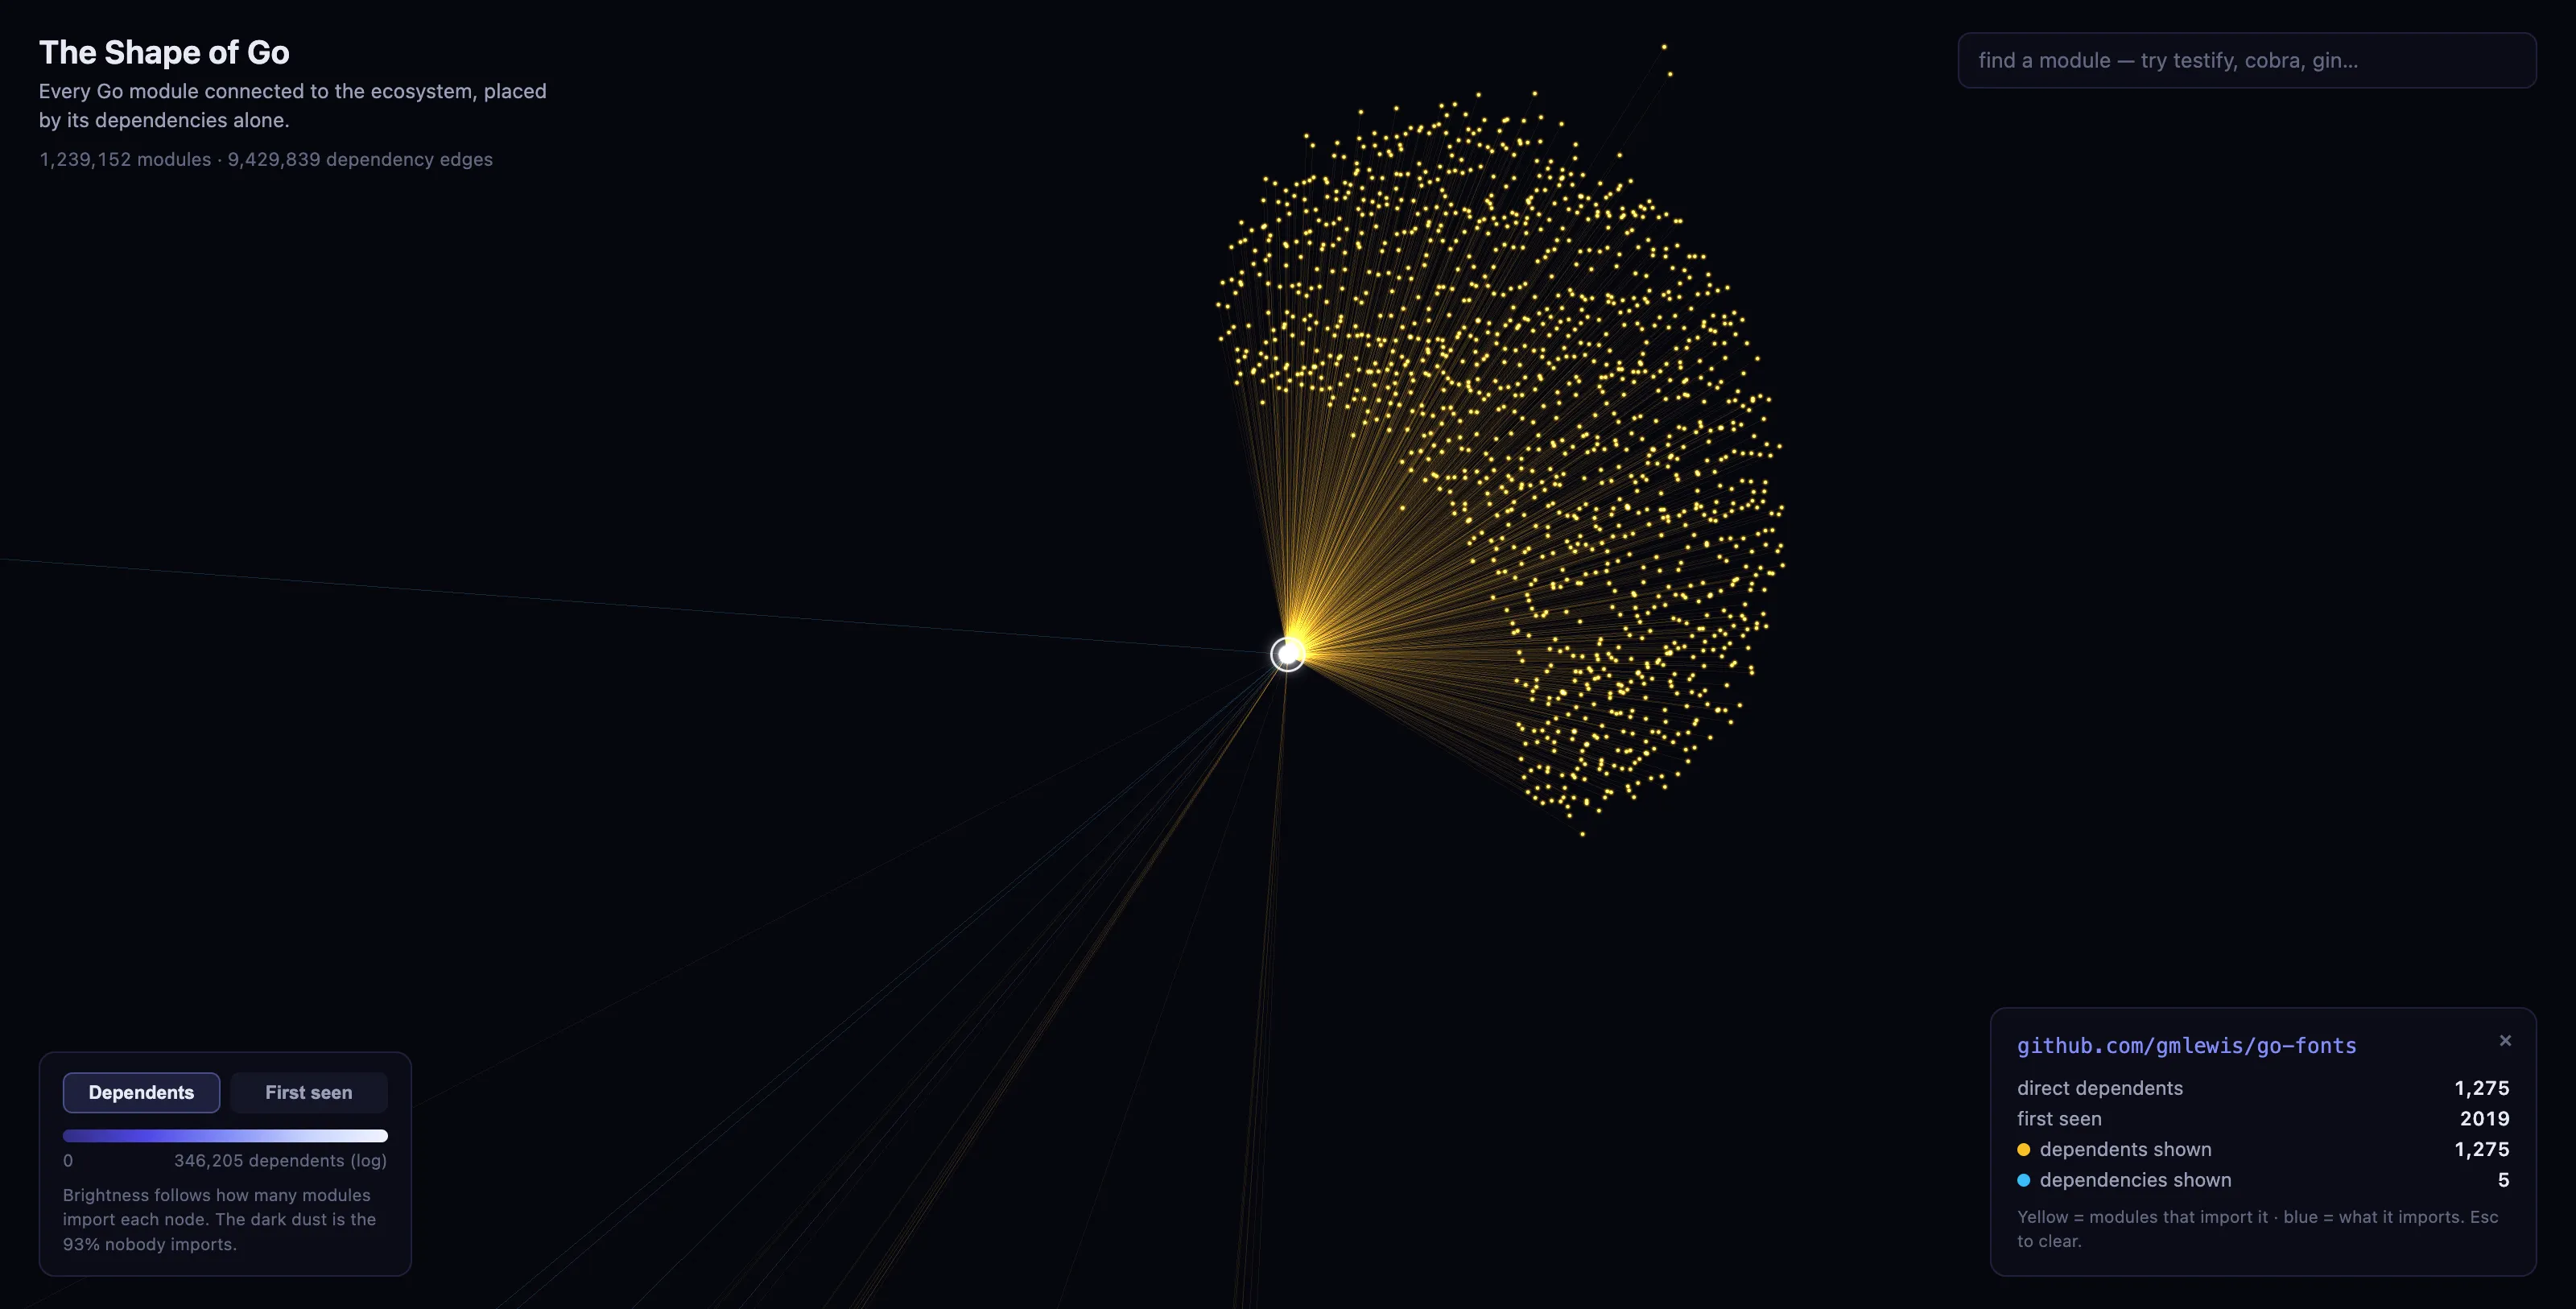
gmlewis/go-fonts and its family, alone at the rim: 1,275 dependents, 1,274 of them the author’s own sub-modules.
The rim placement itself has a clean explanation. ForceAtlas2’s attraction acts along edges while repulsion acts between all masses, so a cluster tied to the rest of the world by only a handful of edges reaches equilibrium far from the core. Distance from the center is a measure of how weakly a system touches the rest of the ecosystem.
The mid-field dust returns us to section 7. The densest clumps, twelve to fifteen hundred modules in a single clot, are the 2024 publishing wave: thousands of modules with near-identical edge profiles, pressed by identical forces into the same spot. A second color mode paints each module by the year it first appeared, and the young gold dust wrapped around the older core is section 7’s finding made visible.
The interactive viewer is at shape-of-go.pages.dev. Every module is searchable, and links of the form ?m=github.com/your/module jump straight to it. The map shows only the connected half of the ecosystem: positions come from dependency edges, and a module with no edges has nothing to be placed by, so the 1.4 million isolated modules have no meaningful place on it.
10. Building it
I ran this entire pipeline on my M3 Max laptop, and every stage is resumable, so anyone with bandwidth and patience can rebuild the dataset.
| stage | what it does | scale and time |
|---|---|---|
| indexsync | stream the full module index, checkpointing per page | 51,458,393 records, 6.3 GB, 1h57m |
| fetchmods | resolve the latest version per path, fetch each go.mod | 2,638,112 modules, 2.3 GB, about 6 hours |
| buildgraph | parse every go.mod into direct dependency edges | 2,632,159 files in 9 seconds |
| analyze | degrees, components, PageRank, the power-law fit | 2 seconds |
| layout | ForceAtlas2 with Barnes-Hut repulsion over the giant component | 600 iterations in about 8 minutes |
| export | pack positions, attributes, labels, and hub neighbor lists into static viewer assets | about 30 seconds |
The interesting engineering was mostly politeness, and I initially misread what the proxy was telling me. My first fetcher ran 64 workers, and the proxy pushed back gradually: throughput started near 740 requests per second and decayed to 335 within fifty minutes, with occasional full stalls. I stopped the run at about a million modules and rebuilt it around a token bucket capped at 120 requests per second, and at that rate the proxy stayed happy: the remaining 1.6 million modules fetched without incident in four and a half hours.
The 403 responses were a different phenomenon, and I initially confused the two. My first safety valve paused the entire fleet whenever any worker saw a 403, on the assumption that a 403 meant throttling; it deadlocked within minutes, because a small set of modules returns 403 permanently no matter how politely you ask, and they are exactly section 8’s blocklist. The replacement, a circuit breaker that pauses the fleet only after thirty consecutive 403s with no success in between, kept things moving, but in hindsight nearly all of its pauses were false alarms of the same kind: blocklisted modules are often published in families with adjacent names, so a sorted work queue occasionally serves thirty of them in a row. Every one of the 4,954 fetches that ended in a recorded error was retried later at low speed, and not a single one recovered; the permanent failures are exactly the blocklist plus 37 dead paths.
The other half of the engineering is resumability. Every stage checkpoints its progress, holds a lock against double launches, and continues cleanly after being killed; the index sync survived laptop sleep, and the layout run survived a full restart mid-computation.
The analysis stage runs on gonx, a Go graph library of mine. The directed-graph support it needed, Digraph, PageRank, and weakly connected components, was proven inside this project first and then extracted into gonx v1.1, which makes shape-of-go the library’s first public consumer, running on the code it seeded.
11. Notes
The graph is a snapshot: the index was synced on August 6, 2026, and
every number in this essay refers to that date. The
repository contains the
six pipeline stages as standalone commands, one go run each, and the README documents the exact invocations; a full rebuild
from nothing costs roughly nine hours of wall-clock time and about
9 GB of disk, most of it spent being polite to the proxy.
This project was built with AI assistance; every number in the essay is reproducible via the commands in the repository.